Is the comparative underfunding of Alzheimer's research ageist, sexist, or racist?
Perhaps the answer is, all three
According to Newsweek, while the number of deaths due to HIV, stroke, heart disease and prostate cancer all dropped between 2000 and 2010, deaths attributable to Alzheimer's increased 68 percent, according to the Alzheimer's Association. It is now the sixth leading cause of death in the U.S., (and at that, likely under-reported.)
Women in their 60s are twice as likely to develop Alzheimer's as breast cancer. And by the time a woman turns 65, her estimated lifetime risk of developing Alzheimer's is 1 in 6 (it's nearly 1 in 11 for men). Older African-Americans are about twice as likely as older whites to have Alzheimer's and other dementias.
Oldest drivers' risk of fatal crashes has fallen,
even as miles driven climbs
The Insurance Institute for Highway Safety recently released a report showing that older drivers' risk of serious injury or death has fallen in the last fifteen years, although when they are involved in crashes, older drivers are still more likely than younger drivers to suffer the consequences.

This chart summarizes one key result of the IIHS analysis. It compares drivers 70-74, 75-79, and 80+ with, as a baseline, drivers 35-54. You can see two interesting trends here.
- 80+ drivers' fatality rates fell the most, although they remain significantly higher that the rates for younger drivers
- Fatality rates for all drivers under 80 seem to be converging
The general trend for all fatalities reflects the gradual updating of the total vehicle fleet; more and more vehicles are fit with ABS and stability control, helping drivers avoid accidents, and more and more have air bags, helping drivers survive the accidents they do have.
The higher rates of fatality for the oldest drivers (which mirror the probability of injury, as shown in other studies) simply reflect the inevitable physical frailty of drivers in their 80s and 90s. The IIHS is considering establishing a new vehicle safety testing standard ("Silver Standard") that would reflect a vehicle's ability to protect older drivers in a crash.
The risk that older drivers present to themselves, and others, is about to get a lot more relevant. Between 1995 and 2008, drivers 75 and older increased their annual mileage by 50%, and there's every reason to believe that as the Baby Boomers age, they'll be less inclined to self-regulate and restrict their driving behavior.
In the coming weeks, Revolutionary Old Idea will be releasing its first White Paper. The topic will be the intersection of Automotive R&D and the age demographics of the driving population.
According to the Kansas City Federal Reserve, Baby Boomers are about to
move from the suburbs into urban apartments
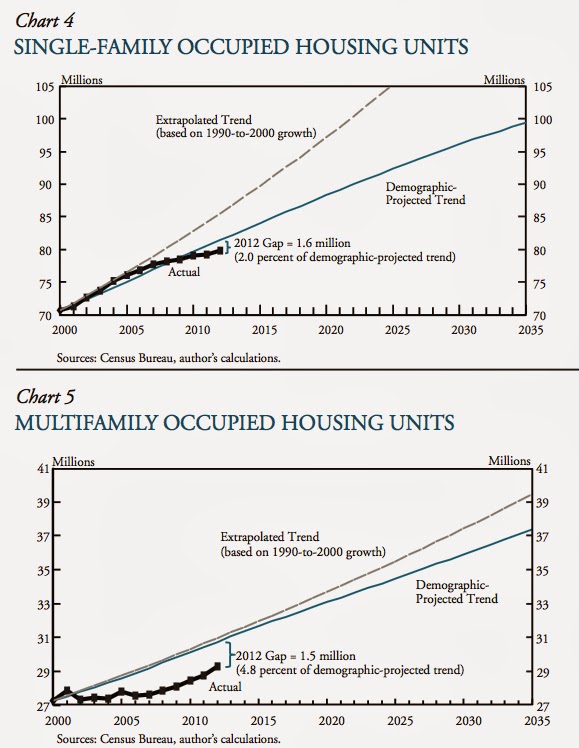
I pulled these two graphs out of a report recently authored by Jordan Rappaport, an economist working for the Kansas City office of the Federal Reserve.
The upper graph looks at growth in single family housing stock. It shows a wide divergence between the growth trend established between 1990 and 2000, and the demographic trend, which indicates the realistic potential demand. This graph proves that the housing bubble, which burst in late 2005, was unsustainable.
The lower graph shows that the bubble (as indicated by divergence of the dashed line and the blue line) was less pronounced for multi-family housing. Not only that, the gap between the number of units available and the projected demand is much larger: 4.8% for multi-family units, compared to 2% for single-family units.
Furthermore, the Fed report shows that the housing collapse was less drastic for multi-family units, and that multi-family construction recovered faster. Why? According to the Fed, a major factor is that Baby Boomers want to downsize, often moving from the suburbs into cities.
The full report is visible here. Two key points are...
- Over the long term, single-family homes are a losing bet. As Rappaport notes, The baseline projections described in this article suggest that construction over the near future will accelerate only moderately for single-family housing but strongly for multifamily housing. Over the intermediate and longer term, even optimistic assumptions project a relatively moderate peak level of single-family construction, which will be followed by a large contraction over many years. Conversely, even pessimistic assumptions project a relatively high peak level of multi- family construction, which will be followed by a decline to a still-high level of construction.
- Cities need to pay attention to the Boomers' desires to downsize and move closer in. For cities, this offers the possibility of revitalization and the shoring up of public finances. But to attract aging suburban households, cities will likely need to offer significant amenities such as safe streets, diverse retail and restaurant options, museums, and venues for theater, music, and sports. Suburbs seeking to retain aging households may need to re-create a range of these urban amenities and enact some rezoning to encourage multifamily construction.
Why the Baby Boomers will drive the market for self-driving cars
There’s been a flurry of media coverage about autonomous vehicles, aka self-driving cars.
- Last summer, Nissan announced that it will offer its first self-driving car by 2020. Volvo’s also promised autonomous vehicles by that date.
- The auto industry consulting firm IHS has estimated that by 2035, nearly 10% of new cars will be self-driving.
- So far, self-driving cars have proven to be safer than human drivers. Google’s research vehicles have driven over 500,000 miles on public roads without causing an accident.
- The Eno Center for Transportation—a sort of automotive think-tank—recently estimated that if even 10% of the cars on the road were self-driving, 1,100 lives would be saved every year.
Eno’s recent report was written by Eno Fellow Daniel J. Fagnant and Kara Kockelman, a prof at the University of Texas. Fagnant and Kockelman finally at least touched on something we here at re: noted last year, which is that this technology has huge implications for aging drivers.
The report cites Dr. Joanne Wood’s 2002 study, ‘Aging Driving and Vision’ in the journal Clinical and Experimental Optometry. Dr. Wood observed that “many drivers attempt to cope with such physical limitations through self-regulation, avoiding heavy traffic, unfamiliar roads, night-time driving, and poor weather, while others stop driving altogether” and draws the logical conclusion that “AVs could facilitate personal independence and mobility, while enhancing safety”.
That’s true, but a colossal understatement, and here’s why: The septuagenarian drivers who Dr. Wood studied over a decade ago—people of my mom’s generation—didn’t see getting their driver’s license as an essential rite of passage into adulthood and independence. So when they “self-regulate” or decide to stop driving altogether, the decision is not freighted with psychological weight.
By contrast, Baby Boomers are emotionally attached to their cars in a completely different way. Even the auto industry has, thus far, dramatically underestimated the significance to Boomers of AVs that can preserve their independence and mobility. (Perhaps the reason for that is that the engineers working on AVs are themselves still young, as are the auto industry’s marketing analysts.)
Lesson from Japan: don't count out older consumers
According to the U.S. Census Bureau, the percentage of the American population over 65 will rise rapidly for the next fifteen years. Senior citizens account for about 13% of the population today, but will account for over 20 percent of the population in 2030.
Here at re: Revolutionary Old Idea we’re fascinated by the aging population because it carries huge implications for brands, marketing, and advertising. But of course there are far wider social, cultural, and economic implications, too. Anyone with an interest in the shape of America’s future is thinking about that demographic change—an inevitable consequence of the Baby Boom.
What will the future be like? Maybe there are clues to be found in Japan, which has the oldest population of any country: 23% of the population is over 65. (This is a ratio that the Census Bureau never projects for the U.S.)
Michelle Gibley, Director of International Research with the Charles Schwab company’s Schwab Center for Financial Research, recently authored a white paper entitled, Japan: Land of the Rising Consumer, which made these observations—which will surprise some people—about Japan’s 30 million seniors.
Normally we think of working-age people as spenders and of the elderly as savers—however, in Japan, its elderly actually spend more annually than the population average (1.29 versus 1.20 million yen respectively). And, with average savings of 22.6 million yen ($226,000), this segment of the population has cash ready to spend.
Japan's elderly are buying more than just staples; they're spending money on toys (for grandchildren), travel, luxury goods, and conveniences. According to a recent survey by the Japan Association of Travel Agents, seniors traveled more than any other group during the second and third quarters of 2012. Supermarkets are redesigning stores geared toward older shoppers. Additionally, technology companies are designing more products to appeal to this demographic:
- NTT DoCoMo introduced a specialized smartphone that caters to older users, featuring larger icons, a touch screen that vibrates, and simplified steps for sending email and taking pictures.
- The robotic pet "Paro," selling for roughly $5,000, offers companionship and is used in "robot therapy."
- Toyota has developed cars with hand controls and seats that swivel to make it easier to get in and out.
- Household technology is also adapting, with products such as beds with sensors that lock doors and toilet seats that rise automatically when someone enters the bathroom.
A trend emerges among moviegoers
@BrandROI's got a little tradition of going to the movies on Christmas Day. This is the time of year when studios tend to release the sort of 'grownup' fare that might get them Academy Awards nominations, so there's always a few releases to choose from.
In the future, we might actually see more films aimed specifically at the mature audience. Look at this chart, courtesy of the Motion Picture Association of America. All the younger demos are trending down or flat at best. But the oldest film-goers—while admittedly still a small percentage of total audience—have gone to more movies every year since 2008.
In the future, we might actually see more films aimed specifically at the mature audience. Look at this chart, courtesy of the Motion Picture Association of America. All the younger demos are trending down or flat at best. But the oldest film-goers—while admittedly still a small percentage of total audience—have gone to more movies every year since 2008.
 |
| (Note: The MPAA hasn't released 2013 data yet.) |
Another reason film studios like older viewers: The older the opening-weekend audience, on average, the smaller the drop in attendance in subsequent weeks. A great example is the film 'Gravity', which had a massive opening weekend and drew a conspicuously mature crowd: 59% of them were over 35. It followed that with a second weekend only 21% smaller—the smallest drop in recent memory.
That's interesting, eh? You'd think that younger audiences, so plugged-in to social media, would be more effective at spreading word-of-mouth. @BrandROI will keep an eye peeled for a plausible explanation of the correlation between an older opening-weekend audience and a film's 'legs'.
The sky is falling! Are dependency ratios alarming? That depends.
There's been a lot of talk about dependency ratios, which are at the root of Social Security alarmism. Part of this generally dismal talk is based on a strict definition of dependency: Anyone over 65 is defined as 'old-age dependent' and anyone under 20 is defined as 'youth dependent'. In case you're wondering, they're dependent on the so-called working population of people 20-65.
By this measure, about 67% of the population was dependent in 2010. That figure will rise steeply, to 83% in 2030. I.E., the dependency ratio will rise about 1% per year with each passing year for the next two decades.

Here @BrandROI, we're not convinced that a simplistic definition of dependency is that useful. First of all, we've learned that in countries like Pakistan, children as young as 8 make great factory workers.
OK, I'm kidding. But seriously, we agree with researchers like Dr. Neal Cutler, a financial gerontologist, who spends a lot of time reminding doomsayers that simple demographic population ratios fail to reflect the fact that not everyone of working age is economically productive, nor is everyone over 65 economically dependent.
So, some people (OK, lotsa' people) say the sky is falling; I say, don't worry so much. Who should you believe? Me, and here's why: I took the U.S. Census Bureau's latest available figures for dependency ratios by state. They vary widely, from Utah at just over 68% to Alaska at around 51%. Then, I looked at the Bureau of Economic Analysis' figures for state-by-state economic growth.
Here's what I found: The economies of the five states with the highest dependency ratios (UT, AZ, FL, ID, SD) averaged 1.8% growth in GDP. The economies of the five states with the lowest dependency ratios (AK, VT, CO, MA, NH) averaged 1.4%. The high-dependency states' economies grew about 20% more than the low-dependency states' economies.
Clearly, the alarmists' view that high dependency=bad, low dependency=good is simplistic.
I have to admit that even I was surprised by this finding. Obviously, states like Utah, with high rates of youth dependency have, by definition, lots of young parents in what are typically thought of as their years of peak productivity.
So I went back into the raw data and built a spreadsheet comparing economic growth to old-age dependency on a state-by-state basis. Predictably, this list was led by Florida, a retirement haven, and includes Arizona and heavily rural states like West Virginia.
In total there are 34 states with rates of old-age dependency higher than the U.S. average. Obviously, that means there are 16 states with rates of old-age dependency below the average. In 2012, the "old" states' economies—which if you believe the alarmists were being dragged down by all those horrible, unproductive people over 65—grew an average of 2.1%.
Meanwhile, the "young" states—presumably supercharged by the high proportion of productive young people—grew a stunning... 2.2%. Yes, the difference was 0.1%.
If a larger proportion of residents over 65 was really a massive drag on the economy, wouldn't you expect a more pronounced differential? Again, I hope Dr. Cutler won't mind if I paraphrase the conclusion that he reached in his own independent research, which is that old age and dependency are not synonymous.
and seventy is the new 50.
The problem: 85's still 85
The venerable U.S. Census Bureau produced this great year-by-year 'age pyramid graph, showing the population structure in 2010 along with estimates of the population structure in 2030 & 2050. These predictions are probably very accurate, especially at the top of the pyramid.
 |
| Click on the graph to see it larger |
As you can see, the purple (2030 estimate) bars for people of ages from about 62-82 are up to double the width of the green bars, indicating actual 2010 census data.
I.E., between 2010 and 2030, the number of Americans in their 60s and 70s will roughly double. During that period, the number of people under 55 in the U.S. will increase only about 15%.
That purple 'Baby Boomer Bulge' indicates a huge increase in sexagenarians (I love that word) and septuagenarians between now and 2030. That's the heart of the mature consumer market that we're obsessed with here @BrandROI. But in percentage terms, the increase in the population of very old people (85+) between 2030 and 2050 is even more striking. That has implications for the 'dependency ratio', which is the topic of a lot of hand-wringing and doom-saying. I'll address some of those concerns in a future update to Daily Factoid.

Check out this graphic, courtesy of Edmunds.com, showing changes in the age of new car buyers between 2007-'11. The percentage of new cars sold to the 18-44 demo that ad agencies are obsessed with fell by about a third, while every age group over 45 increased its share.
What's perhaps even more noteworthy is that just five years ago, the cohort responsible for the largest share of new car purchases was the 35-44 group. Since then it's shifted two cohorts; last year, it was 55-64 year olds who bought the lion's share of new cars.
Meet the 'Mass Affluents'
There's a general consensus among marketers when it comes to defining 'affluent': Families or individuals with over $1M in investable assets. It's a numerically small group that is heavily targeted, especially by luxury brands.
The tier below them are known as the Mass Affluents. Depending on who you listen to, this group is defined variously as those who save more than they spend (Wikipedia), people with between $50-$250,000 in investable assets (not including their homes, Merrill-Lynch). Nielsen uses a higher standard, defining this group as having between $250k-$1M in investable assets.
According to Nielsen, there are about 13 million Mass Affluent households in the U.S., representing about 11% of all households. (This group, incidentally, holds over 1/3 of the country's wealth and had an average income of over $102k in 2011, i.e., their household income was more than 50% higher than average.
Two-thirds of the people in this group are over 55.
- People over 50 are far more likely to start a company than people under 30.
- Older Entrepreneurs have higher success rates.
The numbers tell a different story...
- People aged 55-64 are about 1/3 more likely to start a business than people aged 20-34.
- Even in the tech sector, people over 50 started twice as many companies as people under 30.
- Companies started by people over 50 have a five-year survival rate about 50% higher than companies started by people under 30.